Natural gas (NG) has become an important
part of the energy mix, particularly in electric power generation, where it’s
prized as an easily handled, clean-burning liquid. Liquefied Natural Gas (LNG)
is a more cost-effective way to bring gas to market across oceans and
continents. Construction of many overland pipe-lines is underway, but gas
companies are also investing in LNG supply chains, building massive LNG tankers
to convey gas from port to port, and terminals to convert gas to its form for
easy transport, and back to gas for consumption. In this Paper, we’ll analyze
the challenges of Flow measurement at LNG service applications.
COMMON
LNG FACILITIES POSE METERING CHALLENGES
Flow meters used in LNG custody transfer
should have the following as minimum requirements.
Low Pressure
drop to avoid LNG vaporization.
No moving
Parts.
The ability
to perform in the cryogenic applications.
Proven
ability & accuracy in liquid custody transfer applications.
As in
custody transfer applications flow measurements also need to be verifiable with
check meters and provers.
EVALUATING
FLOW METERS FOR LNG MEASUREMENT
Two different meters can satisfy the
previous said requirements.
CORIOLIS
ULTRASONIC
From field tests conducted at an LNG
facility in Alaska, users were able to determine how accurate the meters were
by comparing flow measurements to level measurements in the LNG dispensing
tanks and onboard a receiving LNG tanker. Under test conditions both meters
offered similar accuracy and good repeatability.
WHAT
IF A CORIOLIS FLOW METER IS INSTALLED?
When a coriolis flow meter is installed, typically dual bent-tube
designs are used to ensure the highest possible performance, causing pressure
to drop and the risk of vaporization resulting multiphase fluid, which makes it
difficult to measure and can introduce significant measurement uncertainty.
Coriolis meters, while immune to changes in flow profile, are only
available in diameters up-to 10” sizes.
While a coriolis meter is a good choice for smaller line sizes and
highly accurate in mass measurement several flow meters would be required to
maximize throughput.
WHAT
IF AN ULTRASONIC FLOW METER IS INSTALLED?
Ultrasonic flow meters on other hand, have a straight flow path and
do not obstruct or impede the gas or liquid flow through a pipeline.
The result is essentially a no pressure drop and reduced risk of
vaporization, results in good accuracy of measurement.
They are also available in larger diameter sizes than coriolis
meters, making them a more cost effective alternative for LNG applications,
where pressure drop and maximizing throughput are prime considerations.
CONCLUSION
Ultrasonic flow meters offer the right
technology and value proposition for custody-transfer applications. The high
accuracy and low maintenance profile for capital investment in the oil &
gas industry, will propel the ultrasonic flow meter market to double digit
growth rates.
Expected Benefits
-
Safe installation at hazardous remote sites.
-
Auto fleet identification at unmanned fuel stations.
-
Auto compensation to base temperature using a
customized equation.
-
Automatic e-mailing of compiled daily dispense report to office
via GSM/GPRS.
-
Web-based HMI that displays dispensing and tank status at
remote site and enables upload and set-up of daily report.
Process Description
When a truck refuels at an unmanned
station, the driver presses the start
button and the message "Enter ID
number" is displayed on the local
HMI. When the ID entered at the local
HMI is authenticated by the controller,
the LNG dispensing sequence starts.
The controller starts a pump to
circulate liquefied gas and cool down
the flowmeter. LNG is then dispensed
to the truck. Then, the controller
compensates the flow volume using
a customized equation for custody
transfer based on the measured
temperature and pressure. On
completion of each dispense, flow
data is saved in the controller as a
file. At the end of the day a report
is created by compiling all the day'
s dispenses on the controller and
is automatically e-mailed to the office for billing purposes.
Application Solutions
Yokogawa provides an innovative automatic custody transfer
system for unmanned LNG fuel stations that uses the
STARDOM FCN controller and a cryogenic version vortex
flowmeter. Safe installation LNG that vaporizes and mixes with air in the proper
proportions can ignite. To prevent accidents at remote
gas stations, the controller is stored in a cabinet with an
intrinsically safe barrier. Fleet identification An ID file storing fleet ID information has been loaded onto
the controller and can be modified online by accessing the
controller web page. When the truck driver presses the start
button, "Enter ID number" is displayed on the local HMI.
When the fleet ID number is entered into the local HMI,
the ID number is sent to the controller and compared with
the ID information in the file. When the ID is authenticated, the
controller initiates the LNG dispensing sequence. However, if
the ID is not authenticated, an error message is displayed on
the local HMI. Liquefied gas dispensing 1. After the ID is authenticated, the controller starts a pump
to circulate liquefied gas through the pipe until the
temperature falls low enough for single-phase liquid flow.
If this cannot be achieved within a given time frame, the
controller stops the pump, displays an "error" on the local
HMI, and returns to idle.
2. When the temperature is low enough, the controller opens
the valve and slowly ramps up the pump speed to avoid
tripping due to sudden increases in back pressure. During
the dispensing, the pressure is monitored and, if it goes
high (due to back pressure problems or the tank being
full), filling stops. If the truck has more than one tank to
fill, the local HMI prompts the driver to connect to the
next tank and continue filling. Once completed, the local
HMI displays the total amount dispensed, and a report is
created in the controller. Flow volume measurement The Yokogawa DY cryogenic version vortex
flowmeter handles process temperatures as low
as -200 deg C with high accuracy (liquid: ±0.75%). Flow correction Flow (measured by the
Yokogawa cryogenic
version vortex flowmeter)
as well as temperature and
pressure are transmitted to
the controller. The flow is
compensated to the base temperature using a customized
equation for custody transfer. Logging file On completion of each dispense, the corrected flow,
temperature, and pressure are saved as an Excel compatible
CSV file in the controller's compact flash memory. This log
file can be uploaded on demand to a PC using the FTP
function and can also be viewed in trend format by accessing
the controller web page. Report file At the end of the day, a report file is created by compiling all the
day's dispense files. As a default, two daily reports are provided.
These are (1) Daily Dispense Report: summary of the day's
dispenses, and (2) Daily Status Report: tank level and pump
usage. These reports are in Excel compatible CSV format and
are completely user definable. The created daily reports are
e-mailed to an office for billing purposes via GSM/GPRS or some
other Internet connection. Also, these reports can be uploaded
on demand to a PC using the FTP function and can be opened in
Microsoft Excel. Web-based HMI The following pages can be accessed at the controller URL:
Tuning Parameter Setting:
Without the modification of applications, parameters can
be set on this parameter web page. These include timer
set points, pressure set points, alarm set points, and PID
tuning parameters. Also,
data logging and report
creation configuration can
be set. Dispense Trend:
The dispensed quantity
and historical trend can
be monitored in real time. Site Status:
Gas station status
information such as storage
and dispensing quantity and
status can be monitored. Alarm notification via e-mail If an alarm occurs, the controller immediately sends to a
specified person an alarm e-mail that contains a log of all
process parameters at the time of the alarm.
Kalkulasi $/kWh dari sistem PLTS ini melibatkan dua komponen, yaitu:
1. Upfront cost: harga yang harus dibayarkan untuk pemasangan sistem PLTS di awal.
2. Life cycle cost: harga yang harus dikeluarkan agar sistem dapat beroperasi dalam jangka waktu tertentu (misalnya selama 20 tahun). Life cycle cost yang paling utama adalah battery. Jika batery dapat bekerja dalam jangka waktu 4 tahun, maka dibutuhkan 5 kali penggantian batery agar sistem dapat beroperasi selama 20 tahun.
I. PERHITUNGAN UPFRONT COST
Untuk sistem PLTS off-grid, komponen upfront cost terdiri dari harga inverter (atau inverter + charger), harga panel, dan harga baterai. Perhitungan masing-masing komponen adalah sebagai berikut:
1. Harga inverter/charger ~ $ 1000/kW
2. Harga solar panel ~ $ 2000/kW
3. Harga battery (upfront cost) ~ $ 1000/kW
4. Harga lain-lain (kabel, box, frame) ~ $ 1000
Total upfront cost ~ $ 5000 / kW
II. PERHITUNGAN LIFE CYCLE COST
Komponen utama life cycle cost adalah battery. Untuk masa operasi 20 tahun, diasumsikan terjadi pergantian batery sebanyak 5 kali, sehingga:
Total Life cycle cost = Harga inverter/charger + harga solar panel + harga battery (life cycle cost) + harga lain2 = Total Life cycle cost = $ 1000 + $ 2000 + $5000 + $ 1000 = $ 9000
Perhitungan selanjutnya adalah menentukan total kWh yang digunakan selama sistem bekerja. Dengan menggunakan asumsi sistem bekerja selama 20 tahun dan energi yang digunakan adalah E_used, maka:
Total kWh = 20 tahun * 365 hari * E_used = 7300 * E_used
Jika untuk sistem yang mampu menghasilkan daya maksimum sebesar 1 kW, energi yang digunakan diasumsikan sebesar 5 kWh, maka:
Total kWh = 20 tahun * 365 hari * 5 kWh = 36500 kWh
Dari data-data ini, maka perhitungan $/kWh dapat dihitung sebagai berikut:
Cost_kwh = (Total life cycle cost) / (total kWh) = ($9000) / (36500 kWh) = $0.24/kWh atau 24 sen/kWh.
The following documents and design tools are aimed at electricians, solar technicians, and professional planners. They offer interesting additional information for all relevant questions regarding the planning of PV systems.
DIRECT CURRENT ( DC ).
Ground connection for thin-film modules and back-contact PV modules
This page is a review of the technological and economical of solar energy advantages disadvantages. The advantages get a lot of publicity, to balance the picture the disadvantages and limitations are highlighted.
Advantages of Solar Energy
In this section I will discuss the solar energy advantages, disadvantages will be discussed in the next paragraph. The advantages are:
Photovoltaic generating systems have no moving part therefore they require a very low maintenance effort, they are reliable and the life expectancy of solar generators can exceed 20 years.
Domestic solar electricity generation systems do not emit polluting gases and do not produce carbon dioxide. It is expected (we already see the initiatives in Europe) that taxes will be imposed on carbon dioxide emissions. You can preempt these future carbon dioxide taxes by installing a residential solar power system and a domestic solar powered hot water heater.
Once the initial investment is covered, electricity supply from the solar generator is effectively free of charge. Based on the last decade trend and with the political turmoil in the Middle East, it is expected that utility electricity will be more and more expensive in the future to reflect the higher prices of fuel; therefore securing a free of charge electricity during the expected future escalation of energy prices is really a benefit
Advantages of Solar Energy
In this section I will discuss the solar energy advantages, disadvantages will be discussed in the next paragraph. The advantages are:
Photovoltaic generating systems have no moving part therefore they require a very low maintenance effort, they are reliable and the life expectancy of solar generators can exceed 20 years.
Domestic solar electricity generation systems do not emit polluting gases and do not produce carbon dioxide. It is expected (we already see the initiatives in Europe) that taxes will be imposed on carbon dioxide emissions. You can preempt these future carbon dioxide taxes by installing a residential solar power system and a domestic solar powered hot water heater.
Once the initial investment is covered, electricity supply from the solar generator is effectively free of charge. Based on the last decade trend and with the political turmoil in the Middle East, it is expected that utility electricity will be more and more expensive in the future to reflect the higher prices of fuel; therefore securing a free of charge electricity during the expected future escalation of energy prices is really a benefit
This system will deliver a maximum of180 watts/15 amps of power via each of two 12-volt cigarette lighter sockets, 140-150 watts of continuous 120VAC/60Hz pure sine wave power via a power inverter, and is wired and fused accordingly. The maximum combined deliverable power at any given moment is approximately 300 watts, limited by the drop in the battery voltage at a discharge current of approximately 25 amps, and is protected against over-current by a 30-amp ATC fuse. If the combined power draw of your electronic devices is 60 watts, the battery will last approximately 4 hours in the absence of incoming solar power before it needs to be recharged, longer if the power draw is less. If the current draw from either of the cigarette lighter sockets exceeds 15 amps, a 15-amp ATC fuse will blow, and will need to be replaced (simple to do; extras included).If the power draw from the inverter exceeds its continuous or surge wattage ratings, it will turn off, and then will need to be re-set (switch inverter power button off, then back on), or a 20-amp ATC fuse will blow and will need to be replaced (extras included).
The battery, solar charge controller, power inverter, 12-volt DC power distributor, wiring, and accessories are housed in a water-, crush-, and dust-proof, protective carrying case in black.The power system components are secured and padded inside the case by custom-configured cubed foam. The solar panel remains outside of the case. Off-Grid Solar Power System - #1 comes with: Battery: 26 amp-hour (312 watt-hour), adsorbed glass mat, sealed lead acid.SolarCharge Controller: 7-amp unit that is protected by a 7.5-amp ATC fuse.Power inverter: continuous 150-watt, pure sine wave unit that is protected by a 15-amp ATC fuse.Solar panel: one foldable 72-watt unit that weighs 6.4 pounds, and that will require 5-6 hours of peak sunlight to recharge the battery from empty to full.To charge the battery via a standard AC receptacle, included is one 3-amp, AC-powered battery charger.To charge the battery via an automobile 12-volt DC cigarette lighter socket, included is one male DC plug with cable.
The case measures 18.50 x 14.06 x 6.93 inches in external dimensions, and the entire system weighs approximately 37 pounds.
This system will deliver a maximum of180 watts of power/15 amps via each of two12-volt cigarette lighter sockets (limited by 15-amp fuses), 150 watts of continuous 120VAC/60Hz power via an inverter (limited by the inverter circuitry), and is wired and fused accordingly. The maximum combined deliverable power at any given time is 360 watts/30 amps, and is limited by a 30-amp ATC fuse. If the combined power draw of your electronic devices is 60 watts, the battery will last approximately 3.5-4 hours in the absence of incoming solar power before it needs to be recharged, longer if the power draw is less. If the power draw from either of the cigarette lighter sockets exceeds 180 watts, a 15-amp ATC fuse will blow, and will need to be replaced (simple to do; extras included).If the power draw from the inverter exceeds its continuous or surge wattage ratings, it will turn off, and then automatically reset itself, or a 20-amp ATC fuse will blow and will need to be replaced (easy to do; extras included).
The battery, solar charge controller, power inverter, 12-volt DC power distributor, solar panel, wiring, and accessories are housed in a water-, crush-, and dust-proof, protective carrying case in yellow.The power system components are secured and padded inside the case by custom-configured foam.Off-Grid Solar Power System - #2 comes with: Battery: 26 amp-hour (312 watt-hour), adsorbed glass mat, sealed lead acid.Solar Charge Controller: 7-amp unit protected by a 7.5-amp ATC fuse. Power inverter: continuous 150-watt, modifiedsine wave unit.Solar panel: one foldable 72-watt unit that will require 5-6 hours of peak sunlight to recharge the battery from empty to full, and that weighs 6.4 pounds.To charge the battery via a standard AC receptacle, included is one 3-amp, AC-powered battery charger that is protected by a 5-amp ATC fuse. To charge the battery via an automobile 12-volt DC power socket, included is one male DC plug with cable.
Microsoft Word - MIPRO-Croatia_TWTcomments_2006.doc
“Smart metering” has demonstrated how advances in technology may be used to solve a utility's changing needs in a dynamic market- place. But where smart metering is effective at the end-customer metering point, new technologies in multifunction “smarter meters” provide a broader range of benefits at any metering point within a utility network.
This paper describes how new communications technologies including local mastering, gateway functionality, web based presentment, e-mail data transfers and Ethernet support of SCADA protocols have been used by power utilities around the world to provide integrated network control and monitoring.
With these technologies, communications costs to remote substations are drastically reduced while still increasing the number of monitored points and improving network awareness. It is shown how these communication links can provide billing data, operational data to supervisory control and data acquisition (SCADA) systems, and regulatory compliant power quality information so that the needs of multiple departments are met within a single device.
Finally, case studies are presented that illustrate how utilities leverage smarter meters to automate tasks such as local aggregation and advanced transformer compensation to simplify network analysis and billing. By providing distributed intelligence, local control and the communications infrastructure to reach more metering points, Smarter metering enables utilities to increase awareness, reduce risk, and lower operational costs.
I. History of Smart Metering
Since the introduction of solid-state metering in the early 1990s, features have been added to tariff meters to provide more valuable information to electric utility companies than simple energy accumulation.
Multifunction meters register active, reactive and apparent energy, time-of-use (TOU) meters track energy consumption at different tariff rates, and remote communications options (fixed network or wireless) have been added for automated meter reading (AMR). A device with the embedded intelligence required to offer these combined features has often been dubbed a “smart meter”.
Smart metering is typically applied at the end customer metering point, be it industrial, commercial or residential, and primarily for billing purposes only. While this covers the largest number of monitoring points in a utility’s network, no additional features are provided where energy flows are largest and operational data is most critical: within the transmission and distribution network.
Recently, “smarter”, more powerful meters have begun to emerge that offer better interface technologies. These provide access to more information than their earlier “smart” counterparts:
SCADA data, power quality and reliability data, loss calculations and error correction, and other troubleshooting data. These new communication technologies can be used to connect to remote mission critical transmission and distribution (T&D) stations, or between devices within these stations.
II. New Communication Technologies
To the substation:
Slow, not broadband, power line carrier (PLC) and serial data modem lines have long been used for remote access to substation data. While effective for basic SCADA telemetry, these media are limited to relatively low throughput rates, generally below 9600 bps. Capacitor traps for PLC systems are expensive to install and maintain, and modem lines are susceptible to electro magnetic noise leading to suboptimal communication rates. For both of these traditional media, complex data types such as digital waveform recordings lead to long connection times and limit a utility’s ability to read all of their installed meters in a timely fashion.
With the growth of wide area networks and the world-wide web, TCP/IP has emerged as a high throughput transportation mechanism suitable for many new media and embedded protocols. Ethernet connections (either twisted pair copper or fibre optic) provide dedicated 10 or 100 Mbps channels capable of addressing all devices within a substation simultaneously. With a data transfer rate 1000 times faster than dial-up modem, TCP/IP can support complex data types without introducing communications bottlenecks. Fibre optic links provide the additional benefit of galvanic isolation, removing a potential failure point from the system.
For remote substations, TCP/IP can be utilized over satellite radio links or broadband power line carrier. In either case, the telecommunications industry has provided the necessary equipment to transmit and decode these signals, simplifying installation and removing integration conflicts.
The TCP/IP address of the end device is all that is needed to configure the system. Finally, email may be used as a transportation mechanism. Relying on TCP/IP for transmission of the individual packets, e-mail allows data to flow seamlessly through firewalls without compromising security.
The information technology (IT) industry has developed systems to accommodate the flow of email traffic while maintaining the security of their networks. Email is preferred in many cases by IT departments than TCP/IP connections alone because of the enhanced security it offers. Smarter meters supporting TCP/IP provide access to all of these communication architectures and the development efforts of the entire communications industry.
Within the substation:
Ensuring a high throughput communications pipeline to the substation is the highest priority in ensuing timely access to metering data. But within the substation, new technologies are also present to reduce the installation cost and improve access to other substation devices.
Ethernet and modem gateways allow one smarter meter to act as a communication hub, routing messages to other devices in the substation over inexpensive RS-485 serial connections (Figure 1). 1). Using such an architecture, only one device needs to be equipped with either the Ethernet or modem hardware, reducing the overall cost of the metering equipment and allowing access to 32 downstream devices or more. When using an industry standard protocol such as Modbus or DNP, the downstream devices are unaware that the request has been passed through a gateway and behave as though communicating directly to the master software or RTU. Older devices can thus be integrated into a newer communications architecture.
Microsoft Word - MIPRO-Croatia_TWTcomments_2006.docMicrosoft Word - MIPRO-Croatia_TWTcomments_2006.doc
Microsoft Word - MIPRO-Croatia_TWTcomments_2006.doc
Figure 1. Using gateways to communicate with devices inside a substation.
Microsoft Word - MIPRO-Croatia_TWTcomments_2006.doc
Another means of integrating legacy devices is through local mastering. In this application, a smarter meter is used as an RTU; requesting information from other devices and passing it backbup to the master software. This opens up possibilities for local data control, such as aggregating feeder readings from multiple devices before transmission back to the master software.
Microsoft Word - MIPRO-Croatia_TWTcomments_2006.docFinally, for data acquisition systems that include transducers without communications capability, smarter meters are available with onboard analog inputs that can directly interface with the output signal of each transducer. Values can be aggregated from multiple transducers and scaled appropriately before transmission to the master software.
Microsoft Word - MIPRO-Croatia_TWTcomments_2006.doc
Figure2. New communication technologies simplify collection of data from existing and new substation devices.
Microsoft Word - MIPRO-Croatia_TWTcomments_2006.doc
III. Extended Interoperability and Data
Access New communication technologies can solve many problems related to data acquisition and speed, but the benefits to utilities are only realized if the information is presented in a ready to use format. Integration with existing utility systems is key to meeting this need.
For each user, system or department, smarter meters present information in the appropriate format over appropriate media. SCADA and Operations systems require industry-standard protocols such as IEC 61850, IEC 60870-5-101, DNP or Modbus. Various device vendors make these protocols available over TCP/IP for high speed direct integration into existing SCADA systems.
Billing systems may require information on energy consumption or demand in protocols such as DLMS, IEC 60870-5-102 or MV90. Again, some software vendors now support data acquisition over TCP/IP using these protocols. In addition to these more traditional uses of data, key account managers may wish to view load profiles, power quality information or alarm conditions. For each of these, the data format and media is customizable, ranging from pager alerts to emailed reports, to web-accessible graphical views.
Finally, other utility departments may wish to view the information contained in a smarter Mmeter. By providing a secure web server on the device, authorized persons can view critical information in real-time from any computer any where in the world .
IV. Case Studies
Using Ethernet to provide data to multiple users
After liberalization, a major utility needed to provide daily settlement data to the independent system operator (ISO). The utility chose smarter meters with TCP/IP support and gateway functionality. Forty gateway meters connected to the existing Ethernet wide area network provided high-speed access to over 260 new tariff meters.
By using TCP/IP, there is no concern that the utility or ISO data retrieval will interfere with each other and the utility network now supports complex power quality data at any of its monitoring points.
Using satellite to overcome geographical challenges
An electrical utility with a 70,000 square kilometre service area needed access to remote substation data. Due to limited existing infrastructure, TCP/IP over satellite links provides access to real-time SCADA data. Transient events, sag/swell events and transformer loading alarms for the substation are sent by e-mail over satellite to PCs and pagers.
Using local mastering to increase efficiency
Managers at a switchyard needed combined instrument / transformer loss compensation and power factor monitoring, plus aggregation and scaling of real-time data. By monitoring transformer and instrument losses on the secondary side, installation costs are reduced without sacrificing accuracy.
The switchyard is a 500kV transmission facility with 10 bays, handling power flowing to and from four different independent power producers, a nuclear facility, and several other substations. Substation bays operate as four loops, with smarter meters configured as Mod-bus Master devices, each gathering real-time data from its loop to perform scaling and aggregation before passing values to a central RTU.
The network fully integrates with the existing billing system and provides a valuable backup function if the RTU or communication links fail, the data can be retrieved manually from the onboard non-volatile memory of each meter. When generators go online and merchant sites produce their own power, the breakers close and the meters go offline.
Microsoft Word - MIPRO-Croatia_TWTcomments_2006.docFigure 3 Information flow from smart meters
Microsoft Word - MIPRO-Croatia_TWTcomments_2006.doc
V. Conclusion
Applying the new technologies of the telecommunications industry to metering systems allows utilities to increase network awareness and control. Combining these technologies with powerful multi-function metering platforms provides opportunities for utilities to reduce operational risk, solve business needs, and improve network reliability.
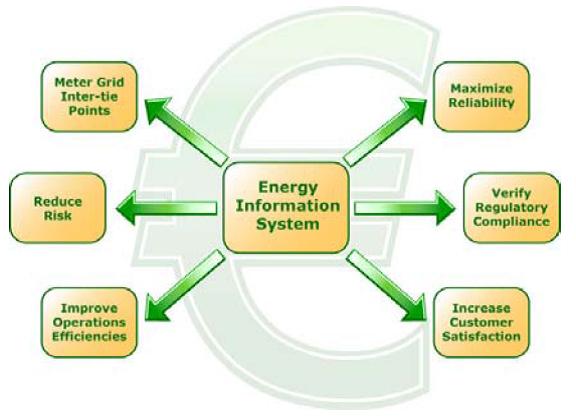
Microsoft Word - MIPRO-Croatia_TWTcomments_2006.docFigure 4 Benefits of new “smarter meter” communications technologies

 RTU is focussed on responding to
supervisory control sequences from multiple masters / slaves where comms can
fail at any time.
RTU is focussed on responding to
supervisory control sequences from multiple masters / slaves where comms can
fail at any time.
 RTU is focussed on responding to
supervisory control sequences from multiple masters / slaves where comms can
fail at any time.
RTU is focussed on responding to
supervisory control sequences from multiple masters / slaves where comms can
fail at any time.